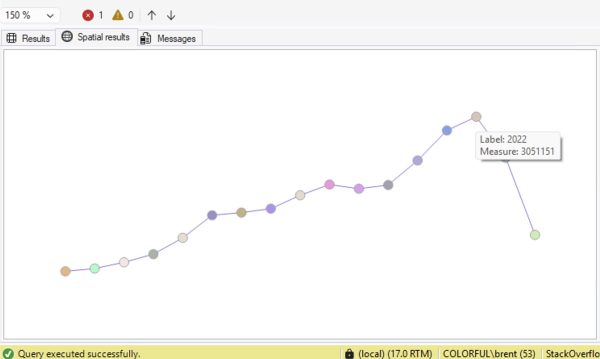
Ever just need a quick visualization of some numbers to get a rough idea of the trend, like this:
Option 1: ask Copilot to write the query for you.
In SSMS v22.3 and newer, with the results query on your screen, open up SSMS Copilot and copy/paste this into the prompt:
Given the query in this window, graph the results as a line chart in the SSMS Spatial Results tab using these rules: 1. Wrap the original query in a CTE called SourceData 2. Create a ScaledData CTE that scales X values to 0–300 and Y values to