Introduction
The infographic designer’s visuals allow you to create nice reports with infographic icons. You will be able to see reports like this one:
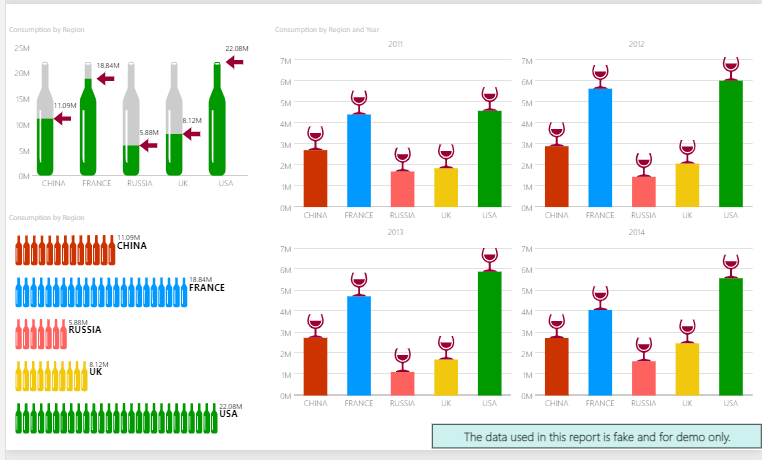
Or this one:
In this article, we will learn how to use this visual and how to configure it.
Requirements
First, we need to have Power BI Desktop installed.
Secondly, we will have SQL Server installed and the AdventureworksDW database installed. However, you can use other tables and other sources with similar information instead. I will use the product information and the standard cost columns from the DimProduct table of the AdventureworksDW database. I