Introduction
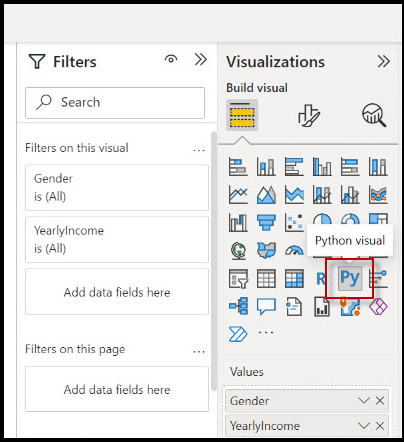
In this article, we will learn how to visualize data using Python in Power BI Desktop. Python is an extremely popular programming language and it includes several libraries that can be used for charts.
In other words, if you do not know how to use the Python visual, this article is for you.
If you know how to use it, do not waste your time here. The article is for newbies, but I promise to have more complex charts in the future.
Requirements First, we need to have SQL Server installed (we could work without SQL Server,